Introducing the CaseFabric Debugger
Introduction
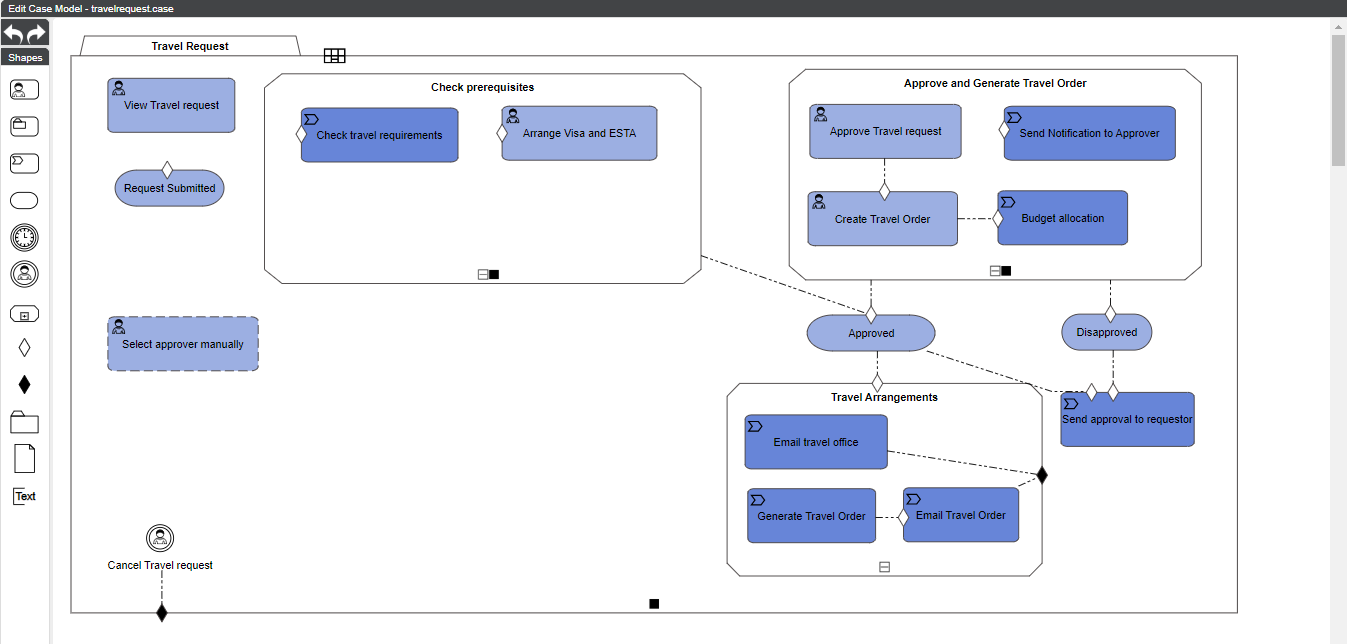
The CaseFabric Engine comes with an IDE in which you can design CMMN based case models.
The cycle of designing, running and debugging a complex model is not straightforward. CaseFabric recommends to use all the well known software development tools that are available for this.
In addition, CaseFabric Engine comes with a few special options to help in the area of debugging case models.
This page explains how to setup these features.

Case Engine events
Each time a case is started and run inside the CaseFabric Engine, the commands that are sent to the case (e.g., start a case, complete a task) result in changes. These changes are stored as events in the underlying database.
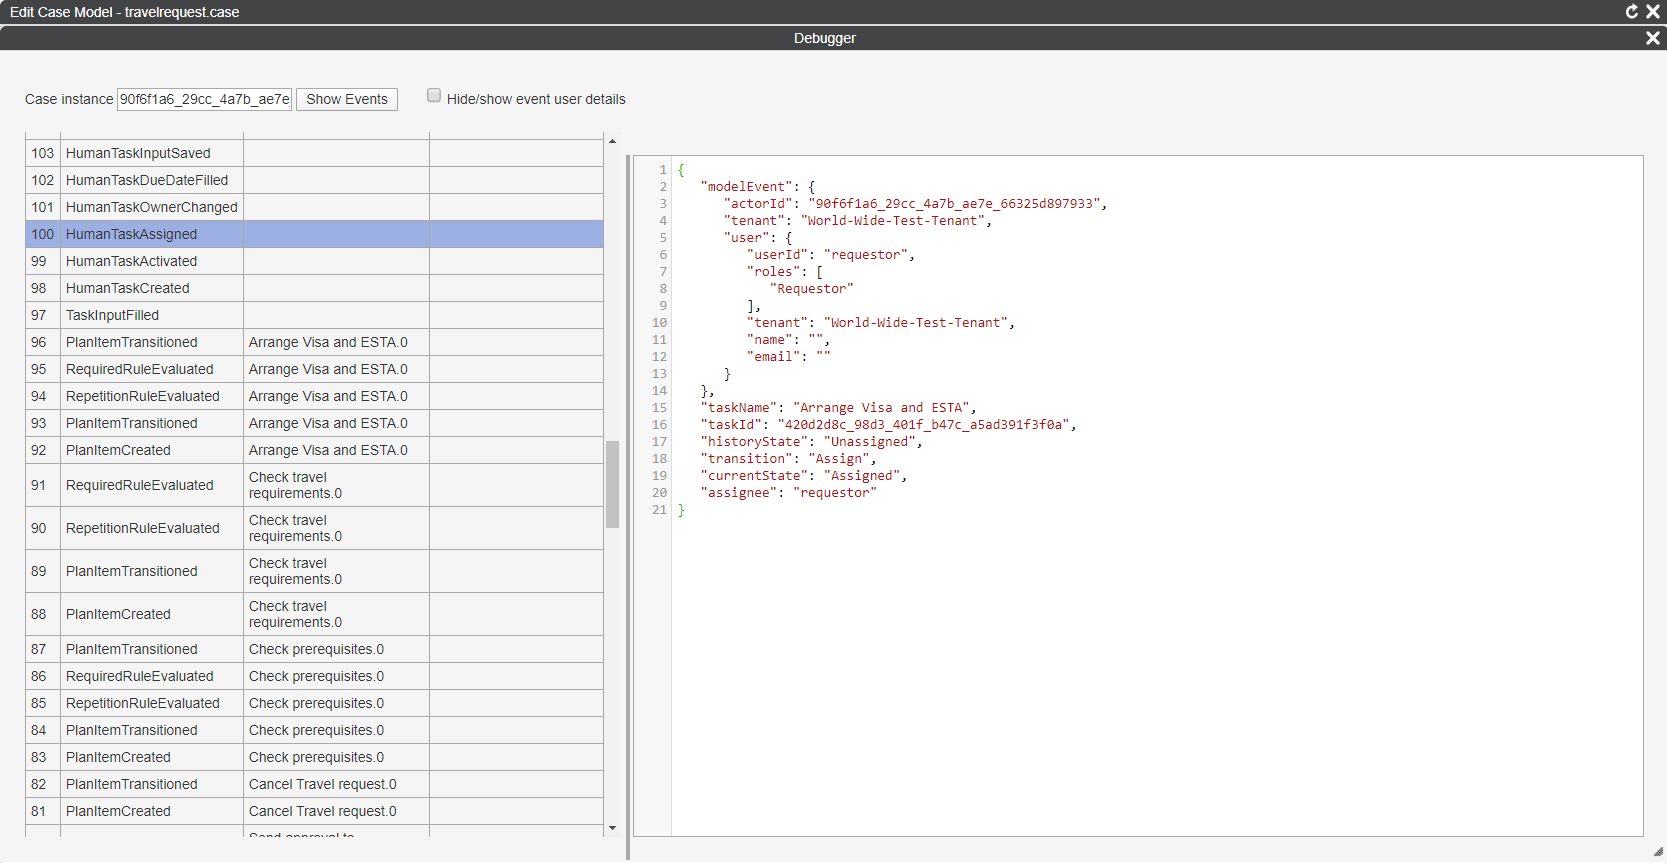
Inside the CaseFabric IDE, a debugger is available that can render these events. You can open it through the right-most halo of the case plan model.

The debugger can render events of individual case instances.
When you copy paste the case instance id into the debugger, and press the Show Events button, the events will be retrieved from the engine and rendered in the screen.

Or ... not?!

Debugger Route
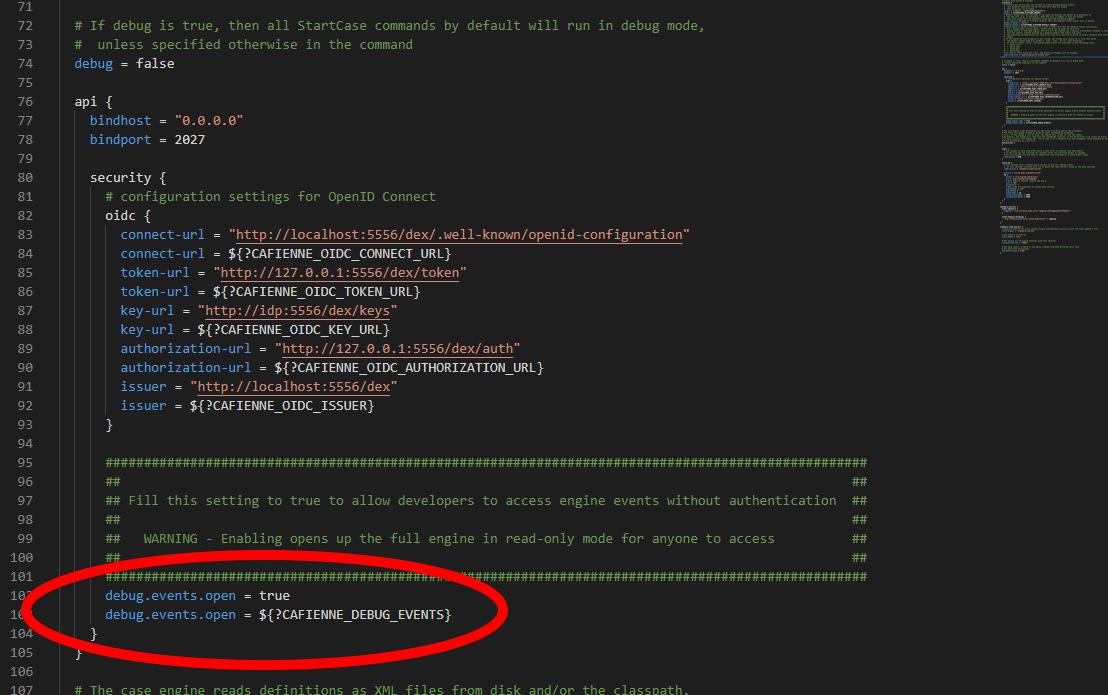
In order to show events in the debugger, the Case Engine must open up the debug API.
The default configuration that comes with getting-started has this option enabled.
It can be changed inside the ./src/local.conf settings.

More logging
The above screenshot of local.conf starts with a debug=false option.
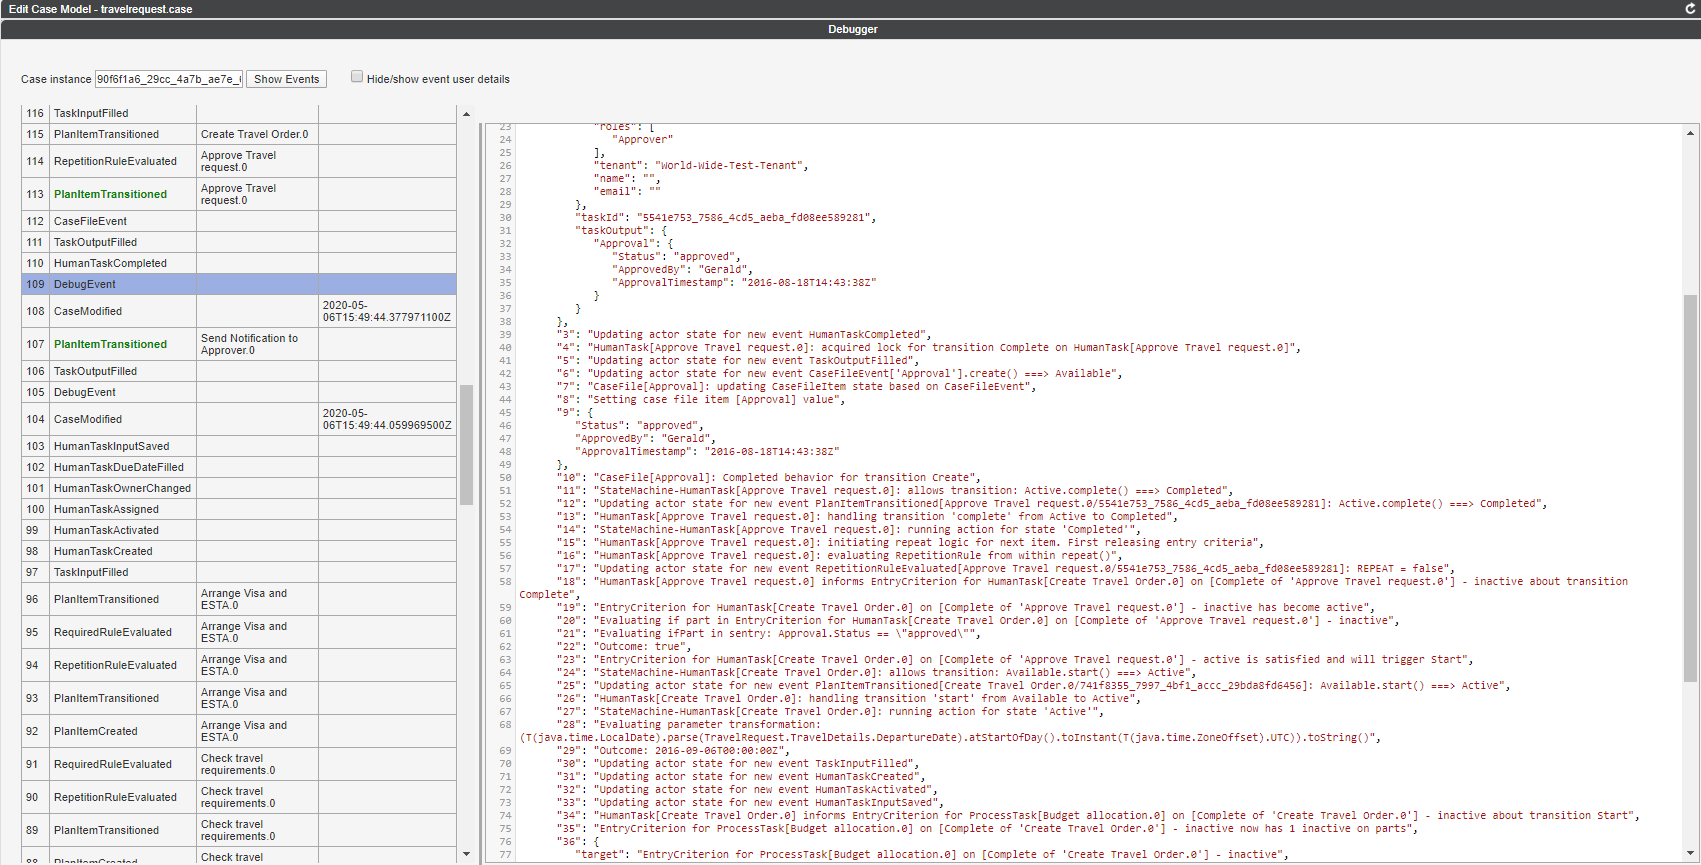
This option determines whether cases will be started in debug mode by default.
If a case runs in debug mode it will generate additional logging information in a special type of event, called DebugEvent. Running the debugger from the IDE gives a lot of inside information from the engine.

